
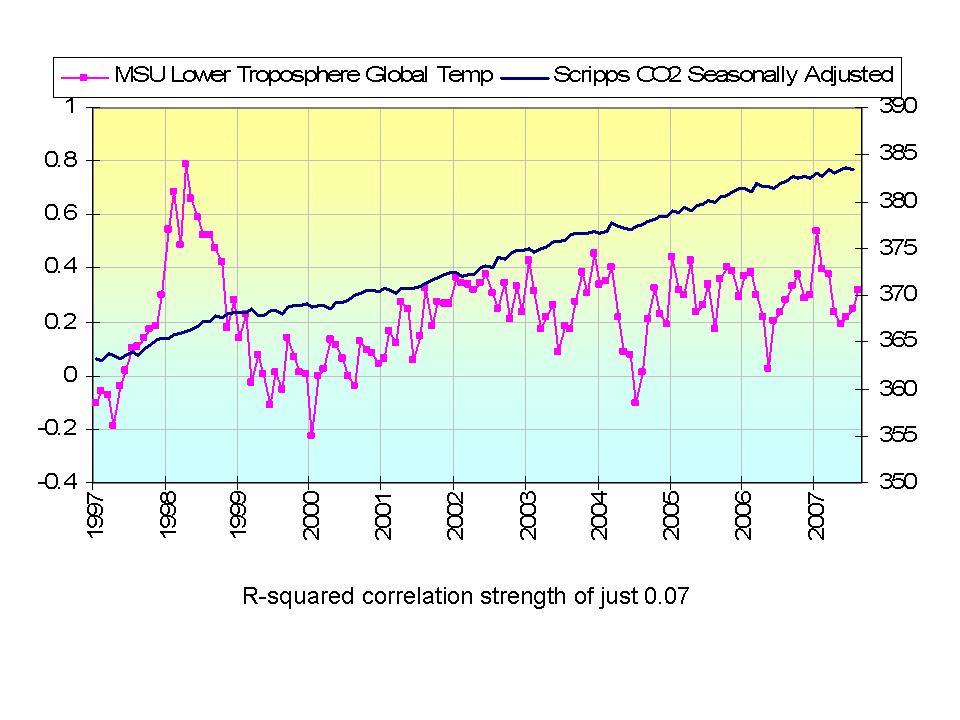
Instead, as CO2 has risen steadily, average global temperatures since 1998 have been in decline. The reason for the 1998 spike is the super El Nino that warmed the Pacific. (Via ICECAP)
And in other global-warming news ...
- The National Hurricane Center is being accused of artificially inflating the number of officially designated hurricanes.
- American CO2 output declined in 2006 by 1.6 percent -- but the greens aren't happy, presumably because the decline didn't come through command-and-control regulations.
- Not that such regulations work: European emissions continue to rise (as seen below). So much for Kyoto.


1 comment:
Bravo! That graph should be on the wall of every school classroom in the world.
Not only is there very little correlation between CO2 and temperatures, there is no correlation between where the planet is warming and where the CO2 is densest. But there is a very good correlation between areas of greatest warming and areas of greatest geomagnetic change at the core-mantle boundary. See http://www.freewebs.com/psravenscroft for the prelims.
I think the real problem is oilout. That word you can Google, if interested.
Peter Ravenscroft.
Geologist, Closeburn, Queensland, Australia.
Post a Comment